

Education
Searching for the best way to learn to trade? Explore our trusted trading education platform.
Tutorial
Learn to trade with real-time guidance from experts
Learn to trade with real-time guidance from experts
Learn to trade with real-time guidance from experts
Learn to trade with real-time guidance from experts
التعليم

Educational Material
Forex for beginners
1 - What is forex ?
Learn Forex: A Beginner's Guide
Forex trading, also called foreign exchange trading, is the process of buying and selling currencies to capitalize on changes in exchange rates. If you're new to the world of trading, ITC Pros gives you the foundational knowledge you need to start your journey with confidence. We’ll take you through forex trading in a straightforward and practical way.
1. What Is Forex Trading?
Forex trading is the exchange of one currency for another, typically in pairs like EUR/USD or GBP/JPY. The goal is to profit from changes in currency prices. For example, if you think the euro is going to get stronger against the US dollar, you could buy EUR/USD. If your prediction is correct, you can sell it later at a higher price.

Imagine you’re planning a trip to Europe and exchange your dollars for euros. If the euro's value goes up while you’re on vacation, you can exchange your leftover euros for more dollars than you originally paid. That’s essentially how forex trading works, but on a larger scale.
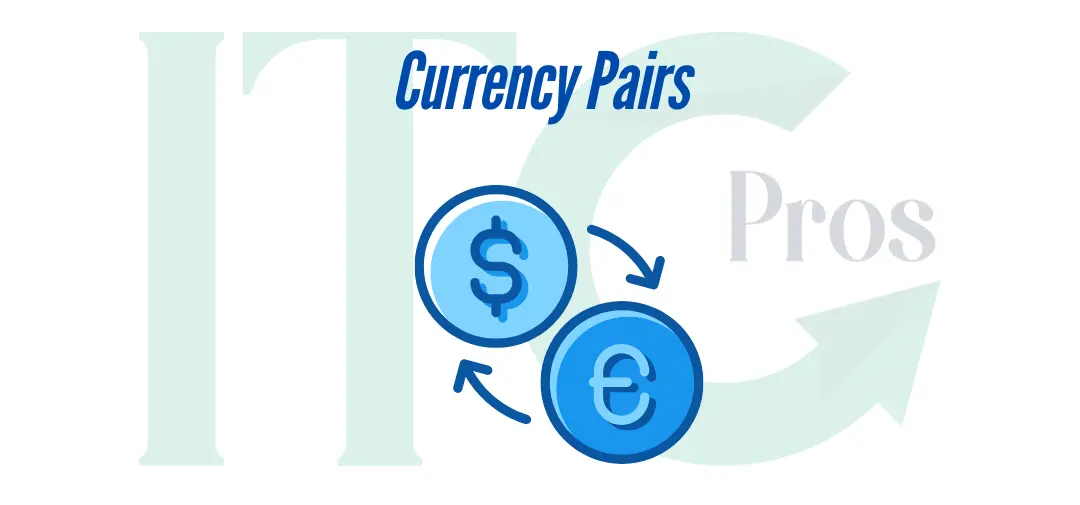
2. Understanding Forex Pairs
Currencies are traded in pairs. Here’s what a typical currency pair looks like:
EUR/USD = 1.0491
– Base Currency: The first currency (EUR) is the base currency.
– Quote Currency: The second currency (USD) is the quote currency.
– Exchange Rate: This number (1.0491) tells you how much of the quote currency (USD) you need to buy one unit of the base currency (EUR).
Example: If EUR/USD moves from 1.0491 to 1.0591, the euro has strengthened against the dollar.
Let’s say you start with $1,000 and buy euros at 1.0491.
This means you get 953,19 euros. Later, the exchange rate rises to 1.0591.
By selling euros, you receive $1,009.52. That’s a $9.52 profit from this small movement.
3. Key Forex Terms
To navigate forex markets, familiarize yourself with these terms:
– Pip: The smallest price movement, usually the fourth decimal place (0.0001). For example, if GBP/USD moves from 1.2640 to 1.2645, it has moved 5 pips.
– Lot: A standardized trading size. A standard lot is 100,000 units of the base currency, while mini lots (10,000 units) and micro lots (1,000 units) for smaller traders.

– Leverage: Borrowed capital that allows you to trade larger positions than your account balance. For example, with 100:1 leverage, you can control $100,000 with just $1,000.
– Spread: The difference between the sell price and the buy price. For example, if EUR/USD has a price of 1.0491 and an ask price of 1.0493, the spread is 2 pips
4. Types of Forex Traders
Forex traders can have different goals and trading styles. Here are the main types:
– Scalpers: Focus on quick trades and small profits. For instance, a scalper might make multiple trades within minutes, aiming for 5-10 pips each time.
– Day Traders: Open and close positions within a single day. If you’re trading GBP/USD and expect a 50-pip movement during the day, you’d aim to close your trade by evening.
– Swing Traders: Hold positions for several days to capture medium-term price movements. If you’re analyzing a trend and expect EUR/USD to rise over a week, you might hold your position during that time.
– Position Traders: Hold trades for weeks or months, focusing on long-term trends. For example, you might buy USD/JPY based on Japan’s central bank lowering interest rates and hold until the economic impact plays out.
5. Tools and Resources
– Economic Calendar: Stay updated on key economic events like interest rate decisions or employment reports that impact currency markets. For instance, if the Federal Reserve announces a rate hike, it could strengthen the USD.

– Position Size Calculator: Determine the size of your trade based on your risk tolerance. For example, if you’re risking 2% of your $5,000 account, you’d limit your loss to $100 per trade.
– Demo Accounts: Practice trading without risking real money by using virtual funds provided by brokers. This is a risk-free way to test strategies.
6. Risk Management
Successful traders prioritize risk management. Here are key principles:
– Set Stop-Loss Orders: Automatically close trades at predetermined levels to limit losses. For example, if you buy EUR/USD at 1.0491, you might set a stop-loss at 1.0441 to limit your loss to 50 pips.
– Risk Only a Small Percentage: Never risk more than 1-2% of your trading capital on a single trade. If you have a $10,000 account, aim to risk no more than $200 per trade.
– Diversify Your Trades: Avoid over exposure to a single currency pair. If you’re trading EUR/USD, consider balancing it with trades in GBP/JPY or AUD/USD.
7. Trading Psychology
Your mindset plays a significant role in trading success. Follow these tips:
– Stay Disciplined: Stick to your trading plan, even in emotional situations. For example, if your plan says to exit at 1.0500, don’t stay hoping for more profits.
– Learn From Mistakes: Analyze losing trades to avoid repeating errors. Keep a journal where you record what went wrong and how to improve.
– Be Patient: Wait for clear trading signals before entering a trade. Avoid impulsive trades based on fear or greed.
8. Practical Example
Imagine you’re analyzing GBP/USD.
Your research indicates the UK economy is getting stronger, while the US is showing signs of slowing down. You decide to buy GBP/USD at 1.2640, expecting it to rise. A few hours later, the price moved to 1.2740. You close the trade and make a profit of 100 pips.
Let’s break it down:
– Your account balance: $5,000
– Trade size: 0.1 lot (mini lot)
– Each pip is worth $1 for this lot size.
– Profit: 100 pips x $1 = $100.
This example shows how small movements in forex can result in meaningful profits.
9. How to Get Started
1. Learn the Basics: Use resources like this guide to build foundational knowledge.

Practice: Trade on a demo account to gain experience without risking real money.
Develop a Plan: Create a trading strategy that includes risk management and clear goals.
Stay Updated: Stay updated by following news and market trends to make informed decisions.
10. Continuous Learning
Forex trading is a journey. Stay committed to learning by:
– Reading books on trading strategies.
– Following financial news and expert analysis.
– Joining trading communities to share insights and experiences.
With dedication and practice, you can develop the skills needed to navigate forex markets successfully. Remember, the goal is not just to make money but to trade wisely and sustainably.
2 - What’s aPIP
What’s a percentage in point?
Brought to you by ITC Pros

In the world of forex trading, the term PIP or “percentage in point” is one you will often come across.
It is a standardized unit of measurement used to track changes in the value of a currency pair. Think of it as a small yet crucial increment that shows how much an exchange rate has moved.
At ITC Pros, we know that understanding this idea is important for traders. It impacts how capital is decided in forex trading.
Understanding what is a pip.
The smallest standardized move that a currency quote can make. For most currency pairs, it is equivalent to a movement of 0.0001 (fourth decimal place).
Example:
If the EUR/USD exchange rate moves from 1.1050 to 1.1051, that 0.0001 USD change is one pip.
Pips are vital because they help traders:
- Calculate the spread between the bid and ask prices of a currency pair.
- Measure the profit or loss of a trading position.
Exception:
For JPY-based currency pairs, a pip is represented by the second decimal place (e.g., 0.01), reflecting their unique pricing structure.
At ITC Pros, we ensure our traders have access to cutting-edge tools that make tracking and understanding pips seamless.
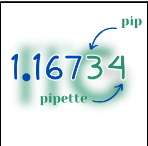
What is a Pipette?
Some brokers, including ITC Pros, offer fractional pips or pipettes that are useful for achieving greater precision.
A pipette represents a fraction of a pip and is displayed as the fifth decimal place (or third decimal place for JPY currency pairs).
Example:
If the EUR/GBP exchange rate moves from 0.87215 to 0.87216, that 0.00001 GBP change is one pipette.
Think of pipettes as the “tiny ninja moves” of currency prices—capturing those subtle, fractional shifts that standard pips cannot. This level of detail helps traders at ITC Pros make even more informed decisions in volatile markets.
Why Understanding Pips is Important
Knowing how to calculate and interpret pips is essential for every forex trader. They not only measure market movement but also determine the profit or loss in trades.
At ITC Pros, we offer helpful resources, trading tools, and personal support. Our goal is to help you understand important ideas and succeed in the markets.
Start your trading journey with ITC Pros today. With our advanced tools and expert help, you will always stay ahead in forex trading.
3 - What is Spread
Learn Forex : What is Spread?
Brought to you by ITC Pros
When you trade forex, you will see two prices for each currency pair. Here are the bid price and the ask price. The bid price refers to the price at which you can sell, while the ask price is the price at which you can buy.
The difference between these two prices is known as the spread. Let’s go through it step by step.
Understanding:

- Bid Price: This is the price at which you can sell the base currency.
- Ask Price: This is the price at which you can buy the base currency.
- Spread: The difference between the bid and ask prices. This represents the broker’s fee for facilitating the trade.
Unlike traditional trading fees, the spread is built into the buy and sell prices of the currency pair. This means you don’t pay a separate transaction fee but the cost of the trade is embedded in the spread.
How Does It Work?
Imagine you’re trading EUR/USD, and you see the following prices:
- Bid Price: 1.08774 (sell price)
- Ask Price: 1.08792 (buy price)
If you want to sell euros, you’ll sell at the bid price of 1.08774.
To purchase euros, you would buy at the ask price of 1.08792.
Here is the difference between these two prices:
Ask – Bid = 1.08792 – 1.08774 = 0.00018 (or 1.8 pips)
An Everyday Example
Think of it like going to a currency exchange office to convert dollars to euros. You might see a board displaying:
EUR/USD
- We Buy: 1.08706
- We Sell: 0.919912
The difference between these two rates is the exchange office’s spread, which is how they profit from providing the service.
Why is it Important?
It is a key consideration for forex traders because it directly impacts your trading costs:
- Tight Spreads: Lower trading costs, ideal for active traders.
- Wide Spreads: Higher trading costs, often seen in less liquid or highly volatile markets.
At ITC Pros, we offer competitive spreads to ensure our traders can maximize their profits while keeping costs low.
Fun Exercise
Using the example above:
- Bid Price: 1.08774
- Ask Price: 1.08792
What is the spread?
(Hint: Subtract the bid price from the ask price!)
At ITC Pros, we provide tools and real-time market data to help you make informed decisions about trading strategies.
4-What Moves the FOREX Market
What Moves the FOREX Market
1- Central Banks: Central banks play a crucial role in the Forex market as they control the supply of their national currency and set interest rates. Any action they take, such as adjusting interest rates or engaging in quantitative easing, can significantly impact the value of their currency. For instance, if a central bank raises its interest rates, the currency may strengthen because higher rates provide higher returns on investments held in that currency.

2- News Reports: News can have a substantial immediate effect on currencies. Economic reports, political instability, or significant events like Brexit can influence investor confidence and investment flows. Positive news may increase demand for a region’s currency, thereby boosting its value, while negative news can have the opposite effect.

3- Market Sentiment: This is a subjective but powerful factor. Traders’ perceptions and expectations about what will happen in the markets can drive currency movements. If the majority of market participants believe a currency will strengthen and trade based on that belief, their actions can lead to an increase in the currency’s value.

4- Economic Data: Data such as GDP growth rates, employment figures, and inflation indicators are vital for traders. These data points help traders gauge an economy’s health and anticipate central bank actions. Strong economic performance may lead to a currency appreciation, while weak performance could depreciate a currency.

5- Geopolitical Factors: Political stability and performance can affect investor confidence in a region. Geopolitical events such as elections, wars, coups, sanctions, and diplomatic changes can lead to substantial volatility in the currency markets. For example, if a country is facing political uncertainty, foreign investors might pull their investments out of that country, leading to a decrease in the demand for that country’s currency and consequently its value. Conversely, signs of political stability and effective governance can boost investor confidence and strengthen a currency.

5-How to place a trade in Forex?
Learn Forex : How to Place a Trade in Forex
Presented by ITC Pros

If you were to trade in small quantities, such as one euro at a time, you would hardly see any significant profit. That’s why forex traders trade currencies in standardized units called lots. These lots allow traders to transact in larger quantities of currency.
What Is a Lot?
In forex, a lot is a standardized unit of currency measurement used for trading. At ITC Pros, we provide access to trading tools and platforms that cater to various lot sizes, including:
- Standard Lot: 100,000 units
- Mini Lot: 10,000 units
Micro Lot: 1,000 units
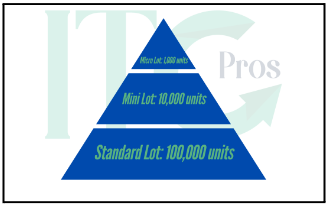
These lot sizes enable traders to participate in the market at various levels. For instance, trading one standard lot means you are trading 100,000 units of the base currency.
The Role of Leverage
You may be considering, “I don’t have enough funds to trade in large quantities.” Does this mean I’m not allowed to trade in forex?” This is where it becomes a game-changer. ITC Pros offers competitive leverage options to help you maximize your trading potential.
Understanding Of Leverage.
Often called a “double-edged sword,” leverage is a tool that lets traders manage a bigger position in the market with less money. It can increase their potential gains, but it also raises the risks involved.

How Does It Works:
When you trade with leverage, your broker lends you a portion of the capital required to open a trade. For example:
- A leverage ratio of 1:100 means that for every $1 you invest, you can control $100 in the market.
- With a $1,000 investment, you could control a $100,000 position using leverage.
At ITC Pros, we provide different leverage options. These options match different trading strategies. They help you succeed and manage risks well.
Advantages of Trading with Leverage
- Increased Market Access: Enables participation in trades that would otherwise require significant capital.
- Higher Potential Returns: Amplifies profits on successful trades.
- Flexibility: Allows traders to diversify their positions without needing large amounts of upfront capital.
Risks
- Amplified Losses: Just as leverage can magnify gains, it can also lead to substantial losses.
- Margin Calls: If your trade moves against you, your account may fall below the required margin, prompting a broker to close your position.
- Emotional Stress: Using leverage can raise the stakes. This may cause people to make emotional choices that can harm profits in the long run.
At ITC Pros, we emphasize risk management and provide educational resources to help you navigate these challenges confidently.
Tips for Trading with Leverage
- Start Small: Use lower leverage ratios as a beginner to minimize risk.
- Understand Margin Requirements: Be aware of how much capital is needed to maintain your position.
- Implement Risk Management: Use stop-loss orders and position sizing to protect your capital.
- Learn More: At ITC Pros, we provide tutorials, webinars, and tools to help you understand leverage and what it means.
At ITC Pros, we assist traders. We offer advanced trading platforms, good leverage, and the education needed to make smart choices.
With the right strategies and tools, leverage can be a powerful ally in achieving your trading goals.
Start your journey with ITC Pros today and take control of your trading future!
6- How to trade with Leverage?
Learn Forex : How to Place a Trade in Forex
Presented by ITC Pros
If you were to trade in small quantities, such as one euro at a time, you would hardly see any significant profit. That’s why forex traders trade currencies in standardized units called lots. These lots allow traders to transact in larger quantities of currency.
What Is a Lot?
In forex, a lot is a standardized unit of currency measurement used for trading. At ITC Pros, we provide access to trading tools and platforms that cater to various lot sizes, including:
- Standard Lot: 100,000 units
- Mini Lot: 10,000 units
Micro Lot: 1,000 units
These lot sizes enable traders to participate in the market at various levels. For instance, trading one standard lot means you are trading 100,000 units of the base currency.
The Role of Leverage
You may be considering, “I don’t have enough funds to trade in large quantities.” Does this mean I’m not allowed to trade in forex?” This is where it becomes a game-changer. ITC Pros offers competitive leverage options to help you maximize your trading potential.
Understanding Of Leverage.
Often called a “double-edged sword,” leverage is a tool that lets traders manage a bigger position in the market with less money. It can increase their potential gains, but it also raises the risks involved.
How Does It Works:
When you trade with leverage, your broker lends you a portion of the capital required to open a trade. For example:
- A leverage ratio of 1:100 means that for every $1 you invest, you can control $100 in the market.
- With a $1,000 investment, you could control a $100,000 position using leverage.
At ITC Pros, we provide different leverage options. These options match different trading strategies. They help you succeed and manage risks well.
Advantages of Trading with Leverage
- Increased Market Access: Enables participation in trades that would otherwise require significant capital.
- Higher Potential Returns: Amplifies profits on successful trades.
- Flexibility: Allows traders to diversify their positions without needing large amounts of upfront capital.
Risks
- Amplified Losses: Just as leverage can magnify gains, it can also lead to substantial losses.
- Margin Calls: If your trade moves against you, your account may fall below the required margin, prompting a broker to close your position.
- Emotional Stress: Using leverage can raise the stakes. This may cause people to make emotional choices that can harm profits in the long run.
At ITC Pros, we emphasize risk management and provide educational resources to help you navigate these challenges confidently.
Tips for Trading with Leverage
- Start Small: Use lower leverage ratios as a beginner to minimize risk.
- Understand Margin Requirements: Be aware of how much capital is needed to maintain your position.
- Implement Risk Management: Use stop-loss orders and position sizing to protect your capital.
- Learn More: At ITC Pros, we provide tutorials, webinars, and tools to help you understand leverage and what it means.
At ITC Pros, we assist traders. We offer advanced trading platforms, good leverage, and the education needed to make smart choices.
With the right strategies and tools, leverage can be a powerful ally in achieving your trading goals.
Start your journey with ITC Pros today and take control of your trading future!
7- Stop Loss & Take Profit
Stop Loss & Take Profit
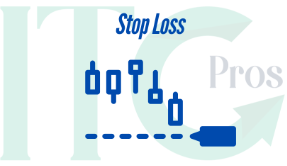
- A Stop Loss is an order placed to close the open position when it reaches a certain price. It is designed to limit an investor’s loss on a position.
- This tool is particularly useful in avoiding large losses during volatile market conditions or when you are unable to monitor your positions closely.
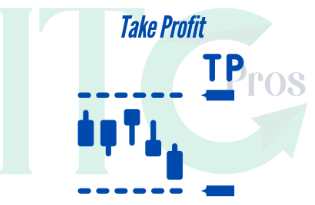
- A Take Profit order is the opposite of a Stop Loss. It is an order given to close a position once the position reaches a specific level of profit.
- This type of order helps traders lock in profits at a desired target without having to continuously monitor their trades.
Pending orders
Pending order is a strategic tool used in trading. It can automatically open a position when certain price conditions are met. It allows traders to plan their entry and exit points in advance, without needing to constantly monitor the market. Here’s how they work:
- Types of Pending Orders:
- Buy Limit: An order to open a buy a position at or below a specified price. The order is placed below the current market price and is executed when the market price drops to or below the order price.
- Sell Limit: An order to open a sell position at or above a specified price. This order is placed above the current market price and is executed when the market price rises to or above the order price.
- Buy Stop: An order to open a buy position above the current market price, anticipating that the price will continue to rise. The order becomes a market order once the specified price is reached.
- Sell Stop: An order to open a sell position when the price reaches a price below the current market price, used to limit a loss or protect a profit on a security that is expected to decline further after the order is placed.
- Execution Conditions:
- A pending order will only be executed if the market price reaches or passes the specified price. If the predefined price is not met, the order remains inactive.
- Expiry Options:
- You can set an expiry date for your pending order, after which it will be canceled if not executed. This feature is useful for aligning your trading strategy with specific market events or data releases.
- Margin Requirements:
- No margin is required to place a pending order. However, once the order is activated (i.e., the specified price is reached), sufficient free margin must be available in your account to maintain the position. If the free margin is insufficient, the pending order will be canceled.
- Types of Pending Orders:
8- What is Margin?
Learn Forex : What is Margin
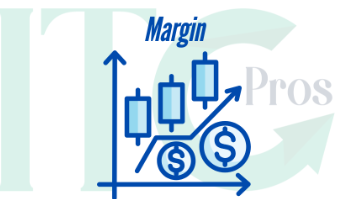
The amount you’re referring to, known as margin, plays a critical role in leveraged trading. Margin is essentially the amount of money required in a trading account to open and maintain a leveraged trading position. It acts as a deposit or collateral held by the broker to cover any potential losses.
Since leverage allows traders to control large amounts of capital using only a small amount of their own funds, the margin is needed to protect the broker against potential losses incurred by the trader. If market movements are unfavorable, the margin helps ensure that the trader can cover the losses.
To calculate the margin, you can use the following formula:
lots x contract size/leverage
Examples:
If a client trades 1 lot of EURUSD in a their trading account with leverage 1:500, his required margin will be: 1 * 100.000 /500= 200 EUR
Margin Call
If the value of the trader’s account falls below a certain threshold due to trading losses, the broker may issue a margin call. This requires the trader to either deposit additional funds into their account or close out positions to reduce the margin requirement.
- As long as the Equity (balance + floating profit/loss) is greater than the used margin, there will be NO Margin Call.
- As soon as the Equity equals or falls below the Used Margin, the client will receive a Margin Call.
- Margin call is not an actual call received from us; it is a simple notification in clients trading platform.
Stop Out
- What is Stop Out?
A Stop Out occurs when your account equity (the total balance including any gains or losses) falls to a certain percentage of the used margin. It is similar to a margin call but typically occurs at a more critical level. While a margin call is a warning, a Stop Out is an automatic action taken by the broker.
- How It Works:
If your account’s equity drops to, for example, 20% of the used margin, the trading platform automatically begins closing your open positions, starting with the one showing the most significant loss. This process continues until your margin level is restored to a safer percentage, above the Stop Out level.
- Purpose of Stop Out:
The purpose of the Stop Out is to prevent your account from falling into a negative balance, protecting both the trader and the broker. By closing losing positions, it releases used margin, which increases your margin level and reduces further risk of loss.
9- Trailing Stop
Learn Forex: Benefits of Trailing Stops
- Brought to you by ITC Pros

A trailing stop is a variation of a standard stop loss order. It adjusts dynamically based on the current market price. It is set at a fixed percentage or dollar amount from the market price, based on the trade direction.
For a long position, the trailing stop is placed below the current market price, while for a short position, it is set above. This strategy allows investors to safeguard profits by keeping trades open as long as the price moves in their favor. However, if the price reverses by the specified amount, the trade is automatically closed.
Trailing stops can be established when placing the initial trade or added afterward, providing flexibility to investors.
Simplified Explanation: A trailing stop is a type of order that changes to protect profits. It keeps adjusting as prices go up, allowing a trade to stay open. If prices go down, it will close the trade automatically.
Getting a Grip on Trailing Stops
Trailing stops are an effective tool for managing trades by locking in profits or capping potential losses. Here’s how they work:
Imagine you set a 10% trailing stop loss on your position. As the price climbs, the trailing stop adjusts upward with it, always staying 10% below the highest price reached. If the price then falls by 10% from its peak, the trailing stop triggers a sell order, protecting your gains or minimizing your losses.
A trailing stop adjusts in only one direction. For long positions, the value increases.
For short positions, the value decreases . It changes as the market price moves in your favor.
Once it adjusts, it stays fixed at the new level, never reversing direction. This makes it an ideal tool for safeguarding profits while still allowing room for growth.
The Art of Setting Stop Loss and Take Profit Levels
Entering a trade involves setting appropriate stop loss and take profit levels. These critical points can often determine the success or failure of a trade, yet they remain one of the most challenging aspects to master
A significant portion of trading education and materials focuses heavily on identifying the ideal entry points for trades. While it’s true that timing your entry is crucial, effective trade management is just as important. This means deciding on good stop loss points, choosing realistic take profit goals, and changing these points as the trade moves forward.
Finding the right balance ensures trades are positioned well. It also helps to increase profits and reduce losses.
In the end, successful trading isn’t just about where you enter, it’s about how you manage the journey from start to finish
Stop losses don’t have to be set in stone. By making them dynamic, traders can effectively lock in profits as a trade progresses favorably while reducing potential losses. However, it’s essential to adjust stop losses only in the direction of minimizing risk or securing profits. This approach ensures that successful trades maximize returns while allowing unsuccessful trades to exit gracefully.
One common example of a dynamic stop loss is the trailing stop loss, which adjusts automatically based on a specified number of pips or a measure of average volatility. Another approach involves periodically moving the stop loss to exceed key highs, lows, or other technical levels. This method keeps the trade alive as long as it remains profitable, giving it the opportunity to “run” without prematurely cutting gains.
For instance, in a long trade, the stop loss might move upward to align with rising support levels. If the trade reverses and these support levels are breached, the stop loss is triggered, terminating the trade. This strategy not only protects profits but also embraces the principle of “letting winners run while cutting losers short”
Dynamic stop losses are especially valuable in uncertain markets, where setting fixed profit targets can be challenging. They allow trades to adapt naturally to market conditions, increasing the likelihood of sustained profitability. Additionally, this approach works in various trading strategies, including short selling, providing traders with the flexibility needed to succeed.
Double tops and Bottoms patterns
Double tops and double bottoms are classic reversal patterns in technical analysis. Often referred to as the “M” (double top) and “W” (double bottom) formations, these patterns signal potential changes in the direction of a trend.
Double Top: The “M” Formation
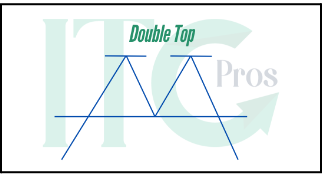
A double top suggests that a price uptrend is losing momentum and may reverse downward. This pattern forms when the price:
- Climbs to a peak within an uptrend.
- Declines but attempts to rise again.
- Reaches a second peak near the previous high.
- Drops beneath the low point found between the two high points.
The name “double top” comes from the price peaking in the same area twice, indicating resistance. Once the price fails to break above this resistance, the pattern is complete, and traders may choose to sell or exit their long positions when the price drops below the swing low.
Double Bottom: The “W” Formation
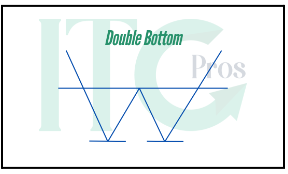
A double bottom indicates that a price downtrend is weakening and may reverse upward. This pattern forms when the price:
- Declines to a low within a bearish trend.
- Initially rises but then starts to fall once more.
- Stops near the previous low.
- Rises above the high of the interim bounce.
The name “double bottom” comes from the price stopping in the same area twice, signaling support. Once the price rises above the resistance created by the interim high, the pattern is complete, and traders may consider entering long positions.
Examples:
If a price rises to $50, declines to $47, then rises to $50.05 before falling below $47, the double top pattern is confirmed. This signals a potential continued decline in price. That’s a “M” Formation.
If a price rises to $50, declines to $47, then rises to $50.05 before falling below $47, the double top pattern is confirmed. This signals a potential continued decline in price.That’s a “W” Formation
What is a Doji Candle?

A Doji candle is a significant pattern in technical analysis, often seen as a potential reversal signal. It forms when the opening and closing prices of a security are approximately equal within a specific time period. The resulting candlestick on the chart has a very small body, resembling a cross or a plus sign.
The Doji candle represents market indecision, where neither buyers nor sellers gain control during the session. Depending on its context within the trend, it can indicate an upcoming reversal or a continuation of the trend. For instance:
- In an uptrend, a Doji may signal a potential bearish reversal.
- In a downtrend, it may indicate a possible bullish reversal.
Traders often use the Doji candle in conjunction with other technical indicators or patterns to confirm its significance before acting.
What is a Short Squeeze?
A short squeeze is a market phenomenon where a heavily shorted security experiences a sharp upward price movement. This forces short sellers—those who bet on the price falling—to close their positions by buying back the shares, which adds further upward pressure on the price.
How a Short Squeeze Operates?
Short squeezes are often triggered by unexpected positive developments that change the market sentiment. As the price rises, short sellers face mounting losses and may be forced to liquidate their positions, often at a loss. This wave of buying amplifies the rally, creating a self-reinforcing cycle.
Key Points to Understand:
- A short squeeze can cause a rapid and significant price increase.
- It is a major risk for short sellers, as losses in short selling are theoretically unlimited.
- Short squeezes can signal a potential market reversal, but the rally is sometimes temporary.
Example:
Suppose a stock index rises by 15% in a single day. Short sellers holding positions expecting the index to fall may rush to cover their losses by buying back shares. This increased buying pressure further drives up the price, creating a compounding effect that sustains the upward trend.
Takeaways for Traders Both Doji candles and short squeezes are critical concepts for traders. While the Doji candle offers insight into potential trend reversals based on market indecision, short squeezes highlight the risks and dynamics of short selling in volatile markets. Recognizing these patterns can help traders adapt their strategies, manage risks, and capitalize on market movements.
At ITC Pros, we provide traders with the tools, resources, and knowledge to leverage candlestick effectively.
Start Trading Smarter Today!
10- Types of Forex Charts
Learn Forex: Types of Forex Charts
- Brought to you by ITC Pros
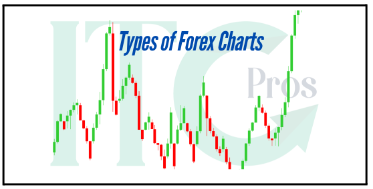
Understanding this is essential for traders aiming to navigate the dynamic world of currency markets. They visually represent historical price movements, offering insights into trends, patterns, and potential trading opportunities.
At ITC Pros, we provide access to a variety of charting tools that empower traders to make informed decisions.
Understanding Of Forex Chart
It is a visual representation of how currency pairs have moved in the past. It provides a historical perspective on price changes across different timeframes, serving as a vital tool for technical analysis.
Forex charting software helps you analyze price changes, predict trends, and make trades easily. For skilled traders, those become powerful instruments for making well-informed decisions in the forex market.
Key Points:
- They display price movements of currency pairs over time.
- Traders use these them to identify patterns, trends, and trading opportunities.
- Common chart types include line charts, bar charts, and candlestick charts.
- Advanced tools like Heiken-Ashi, Renko, and point-and-figure provide deeper insights.
Types of Forex Charts
They can be categorized into basic, intermediate, and expert levels, each offering unique features and utilities.
1. Basic Chart Types
These are ideal for beginners or traders seeking a simplified view of price movements.
- Tick Charts
- Display price data based on the number of transactions (ticks), not time intervals.
- Offer granular insights into market activity during high-volatility periods.
- Limited use in forex due to incomplete volume data from brokers.
Example:
A 500-tick chart generates a new bar or candlestick every 500 transactions. However, accurately constructing these in forex is challenging due to incomplete data from brokers.
b. Line Charts
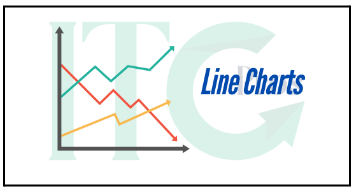
- Simplifies price movement by connecting closing prices over time with straight lines.
- Ideal for identifying long-term trends and smoothing out short-term fluctuations.
Example:
If EUR/USD ends at 1.0450, 1.0500, and 1.0550 over three days, a line chart connects these points. This shows a clear upward trend.
c. Bar Charts
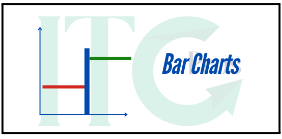
- Represent price ranges with vertical bars, including opening, closing, high, and low prices.
- Useful for identifying volatility and trading ranges.
Example:
On a trading day, the EUR/USD starts at 1.0600. It reaches a high of 1.0700 and a low of 1.0650. The day concludes at 1.10750.
The bar chart shows this range clearly.
2. Intermediate Chart Types
As traders deepen their technical analysis, patterns like head and shoulders, triangles, and cup-and-handle formations become essential. Among these, candlesticks are particularly notable.
Candlestick Charts

- Represent price movements with a rectangular body (opening and closing prices) and wicks (highest and lowest prices).
- Popular patterns include bullish and bearish engulfing, doji, and hammer formations.
Example:
A hammer candlestick signals a potential bullish reversal after a downtrend, with a small body and long lower wick indicating strong buying interest.
3. Expert Chart Types
For advanced traders, specialized chart provide deeper insights and enhanced trend analysis.
- Heiken-Ashi
- Smooth price data by averaging open, high, low, and close prices over multiple periods.
- Ideal for identifying long-term trends and reducing market noise.
- Renko
- Display price movements with “bricks” that form only when the price moves a predetermined distance.
- Emphasize significant trends while filtering out minor fluctuations.
- Point and Figure
- Represent price changes with “X” and “O” columns, focusing on directional movements.
- Excellent for identifying long-term trends and minimizing market noise.
Choosing the Right Chart for Your Trading Style
The chart type you choose depends on your trading strategy:
- Scalpers and Day Traders: Tick and candlestick charts for granular price data.
- Swing Traders: Bar and line charts for medium-term trends.
- Long-Term Investors: Consider using Heiken-Ashi, Renko, and point-and-figure charts for clear trend analysis.
Why ITC Pros?
At ITC Pros, we empower traders with advanced charting tools, real-time market data, and educational resources. Our platforms support all major types, helping you identify opportunities and execute trades confidently.
Start Trading Smarter Today!
Advanced in forex :
1- Technical Analysis in Forex
Technical Analysis in Forex
Brought to you by ITC Pros
Technical analysis is an important tool in forex trading. It helps traders look at price changes and find chances to trade.
At ITC Pros, we provide tools and resources to help you improve your technical analysis and trading strategies.
What is Technical Analysis?

Technical analysis involves studying price movements and trading volume to evaluate investments and identify trading opportunities. Unlike fundamental analysis, which focuses on an asset’s intrinsic value, technical analysis examines statistical trends gathered from historical market data.
This method is widely used across various financial markets, including forex, stocks, commodities, and crypto currencies.
The Theory Behind Technical Analysis

The foundation of technical analysis is the belief that:
- Historical Data Predicts Future Movements: By analyzing past price action, traders can forecast future price movements.
- Price Shows All Information: The price includes all market information. This makes price movement the main tool for making decisions.
- Market Psychology Affects Actions: Charts show people’s feelings, mainly greed and fear, which often come back in similar patterns.
Example:
If a price has often hit a certain level before, traders might expect it to do the same again. This can create chances to trade.
The Basics of Technical Analysis
Here are the core elements of technical analysis:
- Price Analysis: Studying historical price data to identify patterns and trends.
- Chart Patterns: Recognizing shapes like triangles, head and shoulders, and flags that may indicate future price movements.
- Support and Resistance Levels: Identifying key levels where buying (support) or selling (resistance) pressure emerges.
- Trend Analysis: Tracking whether prices are in an uptrend, downtrend, or moving sideways.
- Volume Analysis: Examining trading volume to confirm the strength of price trends.
- Market Psychology: Understanding how emotions influence price action.
- Forecasting: Using technical tools to predict future price movements.
- Risk Management: Implementing stop-loss orders and position sizing based on technical analysis signals.
Benefits of Technical Analysis
- Trend Identification: Helps traders align with the prevailing market direction.
- Optimal Entry and Exit Points: Improves trade timing for better earnings capability.
- Risk Management: Provides tools for setting stop-loss orders and defining risk levels.
- Confirmation of Signals: Aligns with fundamental analysis or market sentiment for greater confidence.
- Availability: Applicable across markets like forex, stocks, and crypto currencies.
- Automation: Many tools can automate analysis and trade execution.
- Historical Insights: Relies on widely available historical price data.
- Flexibility : Adaptable to different timeframes and strategies.
- Continuous Learning: Ongoing skill refinement leads to improved trading outcomes.
Drawbacks of Technical Analysis
- Personal perspective: Interpretations can vary among analysts, leading to conflicting conclusions.
- Limited Scope: Focuses only on price and volume, ignoring broader economic factors.
- False Signals: Can generate misleading signals due to market noise or sudden sentiment changes.
- Over-Relying : Ignoring fundamentals and risk management may lead to losses.
- Lagging Indicators: Many tools rely on past data, resulting in delayed signals.
- Market Control: Factors like speculation and algorithmic trading can distort patterns.
- Complexity: Requires a deep understanding of indicators and strategies, posing a challenge for beginners.
- No Guarantees: Success is not guaranteed, as markets are inherently uncertain.
Why Use Technical Analysis with ITC Pros?
At ITC Pros, we assist traders by providing better tools, real-time data, and learning materials. This helps them enhance their technical analysis skills.
We offer all you need to trade confidently. This includes help with support and resistance levels and advanced charting tools.
Start your trading journey with ITC Pros today
2- Support and Resistance in Forex
Learn Forex : Support and Resistance in Forex
Brought to you by ITC Pros
Support and resistance are fundamental concepts in Forex trading, forming the foundation of many technical analysis strategies. These levels show price points where trends usually stop, change, or continue. They give traders important information to help them decide what to do.
At ITC Pros, we help traders find and use support and resistance levels in their plans.
Understanding Support and Resistance
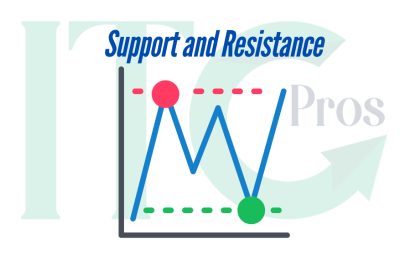
- Support: A price point where a downward trend might stop or change because more people want to buy. This buying interest stops the price from dropping more.
It serves as a price floor.
- Key Insight: Support levels indicate where there will be a surplus of buyers.
- Resistance: A price level where an uptrend may pause or reverse as selling interest increases, preventing the price from rising further. It serves as a cap on the price.
- Key Insight: Resistance levels indicate where there will be a surplus of sellers.
Traders use support and resistance levels to make informed decisions about when to enter or exit trades. These levels can signal buying opportunities near support or selling opportunities near resistance.
Trading Support and Resistance
Bounce Trading
- Buy: When the price nears a support level and rebounds upward.
- Sell: When the price approaches a resistance level and bounces downward.
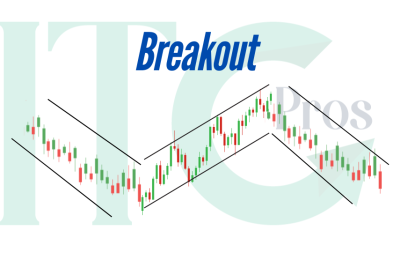
Breakout Trading
- Buy: When the price breaks above a resistance level, indicating potential upward momentum.
- Sell: When the price breaks below a support level, signaling potential downward movement.
What is “Price Breaking”?
Price breaking occurs when the price strongly moves through a support or resistance level, often signaling a shift in market sentiment.
- Breaking Support: When the price drops below a support level, it suggests increased selling pressure. Traders may interpret this as a signal to sell, expecting further price declines.
- Breaking Resistance: When the price rises above a resistance level, it indicates increased buying pressure. Traders may see this as an opportunity to buy, anticipating continued upward momentum.
Example:
- Support Break: If EUR/USD breaks below 1.0400, traders might anticipate further declines.
- Resistance Break: If GBP/USD breaks above 1.2800, traders might expect continued gains.
Golden Rules of Support and Resistance
- Strength with Numbers:The more times a price tests a support or resistance level without breaking, the stronger the level becomes.
- Role Reversal:Once a support level is broken, it often becomes a new resistance level, and vice versa.
- Confirmation: Always wait for confirmation before acting. For example, a decisive break accompanied by increased trading volume can validate the move.
Forex Support and Resistance Examples
- Support Example: Imagine EUR/USD consistently bouncing back up when it reaches 1.0495. Here, 1.0495 is a support level, signaling increased buying interest.
- Resistance Example: Now consider GBP/USD struggling to rise above 1.2700. This level acts as resistance, indicating increased selling interest.
Strategies for Trading Support and Resistance
Bounce Trading
Ideal for range-bound markets where prices oscillate between defined levels.
Traders buy near support and sell near resistance, capitalizing on predictable price reversals.
Breakout Trading
- Suitable for trending markets where prices break through established levels.
- Traders enter when prices decisively move past support or resistance, aiming to ride the trend.
Support and Resistance Insights
- Strength: Levels tested multiple times without breaking are more reliable.
- Confirmation: Wait for increased volume or other technical indicators to validate a breakout or bounce.
- Trend Dynamics: Breaking support may signal a downtrend continuation, while breaking resistance could indicate an uptrend continuation.
Conclusion
Support and resistance are important ideas in Forex trading. They help traders analyze the market and make choices.
By understanding the dynamics of these levels, traders can identify market sentiment, spot trading opportunities, and execute strategies with greater confidence.
At ITC Pros, we provide the tools, insights, and expertise to help you master support and resistance trading.
Start Trading Smarter Today!
3- Trendlines in Forex Trading
Learn Forex : Trendlines in Forex Trading
Brought to you by ITC Pros
They are foundational tools in technical analysis, offering traders a visual guide to the general direction of price movements. At ITC Pros, we believe it’s important to understand trendlines. They help traders see trends, find possible reversal points, and identify support and resistance areas.
What Are Trendlines?

Trendlines are lines on a chart that connect important price points, like high or low prices. They show the overall direction of a market.
They act as a roadmap for traders, providing crucial insights into market sentiment and potential future price movements.
Types of Trendlines:
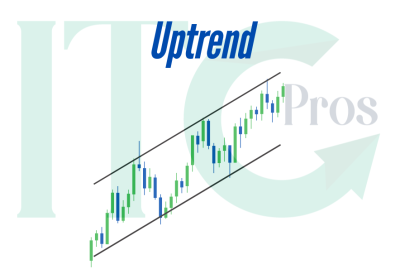
- Uptrend Line: Drawn by connecting higher lows, indicating that buyers are in control and prices are moving upward.
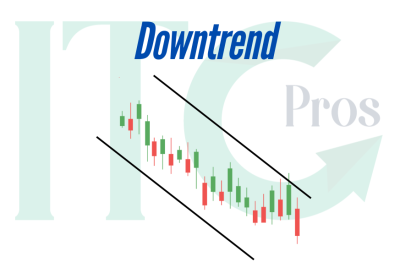
- Downtrend Line: Drawn by connecting lower highs, showing sellers dominate and prices are trending downward.
- Horizontal Line: Used in ranging markets, connecting price peaks or troughs to identify support and resistance levels.
Why Are Trendlines Important?
They provide traders with critical information about the market:
- Trend Direction: Upward sloping lines suggest an uptrend; downward sloping lines indicate a downtrend.
- Support and Resistance: Trendlines can act as dynamic support or resistance levels, offering entry and exit points for trades.
- Trend Validation: The more times a trendline is tested without breaking, the stronger and more reliable it becomes.
- Breakout Signals: Breaching often signals a potential shift in market sentiment or the beginning of a new trend.
How to Use Trendlines in Trading
- Drawing
- For an uptrend, connect consecutive higher lows.
- For a downtrend, connect consecutive lower highs.
- For sideways trends, connect peaks and troughs to create horizontal lines.
- Confirmation Through Touchpoints
While a trendline can be drawn with two points, waiting for a third touchpoint helps confirm its validity. This adds reliability to the trendline and builds confidence in its strength.
- Bounce Trading
- Buy: When the price approaches and bounces off an uptrend line, acting as support.
- Sell: When the price approaches and bounces off a downtrend line, acting as resistance.
- Breakout Trading
- Buy: When the price breaks above a downtrend line, signaling a potential shift to a bullish trend.
- Sell: When the price breaks below an uptrend line, signaling a potential shift to a bearish trend.
Trend Channels
A trend channel is created by drawing a parallel line to your trendline. It offers a clearer view of the range within which prices are moving, helping traders set targets and manage risk.
Example:
- In an uptrend, the upper channel line acts as a target for potential price movements.
- In a downtrend, the lower channel line can be used to set profit targets.
Key Insights for Trendline Analysis
- Breakout Confirmation:
- Use higher timeframes (e.g., daily charts) for validation of trendline breaks.
- Increased trading volume during a breakout adds credibility to the move.
- Acceleration:
- A confirmed breakout should lead to accelerated price movements. If this doesn’t occur, it could signal a false breakout or a potential reversal.
- Patience is Key:
- Avoid chasing breakouts. Wait for a pullback to test the trendline as support or resistance before entering a trade.
Strengths and Limitations of Trendlines
Strengths
- Simplicity: Easy to draw and interpret for traders of all levels.
- Dynamic Support/Resistance: Adapt to changing market conditions.
- Broad Application: Useful across timeframes and markets.
Limitations
- Subjectivity: Different traders may draw trendlines differently, leading to varying interpretations.
- Evolving Conditions: Market changes can render previous trendlines invalid, requiring adjustments.
- False Signals: Breakouts can sometimes lead to reversals, especially during volatile periods.
Example in Action
- Uptrend: EUR/USD forms higher lows, creating an uptrend line. Traders buy when the price touches the line, expecting it to act as support.
- Downtrend: The GBP/USD pair is forming lower highs, establishing a downtrend line. Traders sell when the price touches the line, expecting it to act as resistance.
- Breakout: If USD/JPY breaks below its uptrend line, traders may sell, anticipating further bearish momentum.
Conclusion
Trendlines are indispensable tools for Forex traders, offering insights into market sentiment, trend direction, and potential price movements.
Traders can use trendlines with other tools and strategies. This helps them understand the market better.
At ITC Pros, we offer smart charting tools and learning resources. These can help you understand trendline analysis and make better trading choices.
Begin Trading Confidently from Today!
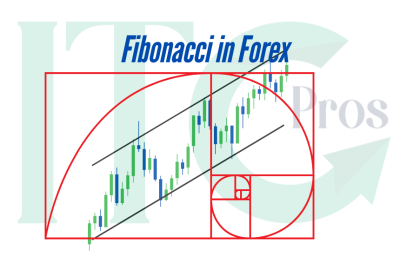
4- Fibonacci In Forex
Learn Forex : Fibonacci in Forex Trading
Brought to you by ITC Pros

A name often associated with mathematical brilliance, has become a cornerstone in technical analysis for traders worldwide.
At ITC Pros, we want to explain the Fibonacci sequence and how it can be used in forex trading. Our goal is to help traders use this information to make better choices.
Who Was Fibonacci?
Fibonacci, born Leonardo of Pisa, was a renowned Italian mathematician from the Middle Ages. He introduced the Fibonacci sequence, a series where each number is the sum of the two preceding ones. For example:
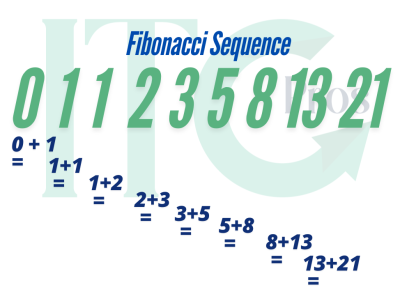
0, 1, 1, 2, 3, 5, 8, 13, 21, 34…
While the sequence itself is fascinating, its significance in trading lies in the ratios derived from it, particularly 61.8%, often referred to as the “golden ratio,” along with 23.6%, 38.2%, and 50%. These ratios are used to identify potential levels of support and resistance in financial markets.
Understanding the Fibonacci Sequence
It frequently appears in nature, art, and now, financial markets. Traders use the ratios derived from this sequence to predict market movements, believing these levels reflect natural patterns within price behavior.
Fibonacci Ratios
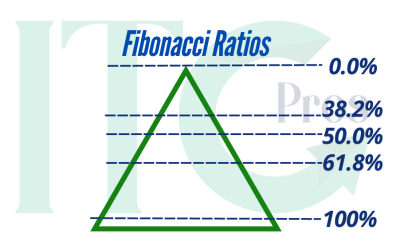
- 23.6%
- 38.2%
- 50%
- 61.8%
- 100%
These ratios serve as key levels for identifying potential price retracements and continuations in market trends.
Uptrends and Downtrends
Uptrend
In an uptrend, Fibonacci retracement levels are used to identify potential support levels where the price might pull back before resuming its upward trajectory.
Example:
If EUR/USD rises from 1.1000 to 1.1500, retracement levels might indicate potential support at 1.0497 (61.8%) or 1.0351 (38.2%), providing buying opportunities.
Downtrend
In a downtrend, retracement levels help identify potential resistance levels where the price might rally temporarily before continuing its downward movement.
Example:
If GBP/USD falls from 1.5000 to 1.4500, levels could indicate resistance at 1.2646 (61.8%) or 1.2582 (38.2%), signaling selling opportunities.
How to Use Fibonacci Retracements in Trading
- Identify the Trend: Determine if the market is in an uptrend or downtrend.
- Set Anchor Points: Select the swing high and swing low on the chart to draw Fibonacci retracement levels.
- Draw Fibonacci Levels: Use charting tools to plot retracement levels (23.6%, 38.2%, 50%, 61.8%, and 100%) between the swing high and low.
- Analyze Support and Resistance:
- In an uptrend, retracement levels act as support.
- In a downtrend, retracement levels act as resistance.
- Confirm Signals: Combine Fibonacci retracements with other technical indicators like moving averages, candlestick patterns, or trendlines for stronger confirmation.
- Implement Risk Management: Place stop-loss orders beyond key Fibonacci levels to protect your trades.
The Significance of Fibonacci Ratios
61.8% (The Golden Ratio)
The most critical Fibonacci ratio, representing natural patterns observed in various phenomena. In trading, it often serves as a key support or resistance level.
23.6%, 38.2%, and 50%
These ratios represent minor retracements, often acting as preliminary support or resistance levels before stronger moves occur.
161.8%
Known as the Fibonacci extension level, this ratio helps traders set targets for price movements beyond the initial swing.
Benefits of Fibonacci Retracements
- Precision in Trend Analysis: Helps pinpoint potential reversal or continuation levels in market trends.
- Enhanced Risk Management: Guides traders in setting stop-loss and take-profit levels.
- Versatility: Applicable across all markets, including forex, stocks, and commodities.
- Ease of Use: Integrates seamlessly with other technical analysis tools for stronger trading signals.
Example of Fibonacci in Action
Scenario: EUR/USD is in an uptrend, moving from 1.1000 to 1.1500. Using Fibonacci retracements, the following levels are identified:
- 23.6%: 1.1382
- 38.2%: 1.1236
- 50.0%: 1.1250
- 61.8%: 1.1150
If the price pulls back to 1.1236 (38.2%) and shows a bullish candlestick pattern, traders may enter a buy position, expecting the price to resume its upward trend.
Conclusion
Fibonacci retracements are powerful tools for identifying key levels of support and resistance in forex trading. By leveraging Fibonacci ratios such as 23.6%, 38.2%, 50%, and 61.8%, traders can anticipate price movements and make informed decisions.
At ITC Pros, we offer trading platforms and learning materials. Our goal is to help you understand Fibonacci retracements and improve your trading methods.
Start Trading with Confidence Today!
5- Forex Fibonacci Extensions
Learn Forex : Forex Fibonacci Extensions
Brought to you by ITC Pros
Fibonacci extensions are powerful tools that help traders set profit targets and predict potential future price levels in trending markets. At ITC Pros, we equip traders with the knowledge and tools to effectively use Fibonacci extensions, enhancing their strategies and improving decision-making.
What Are Fibonacci Extensions?
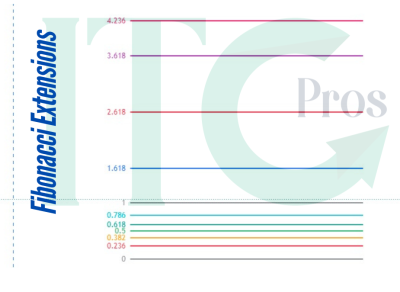
Fibonacci extensions are advanced technical analysis tools used to identify potential price targets beyond the current trading range. Derived from the Fibonacci sequence, these extensions use specific ratios—such as 1.618, 2.618, and 4.236—to project areas where price may encounter support, resistance, or significant movements.
How Do Fibonacci Extensions Work?
Imagine a currency pair like EUR/USD is in an uptrend but experiences a pullback. Traders use Fibonacci retracement levels to identify potential pullback areas, then project Fibonacci extension levels beyond the swing high to anticipate future price targets.
Example:
- Swing Low: 1.0400
- Swing High: 1.0900
Extension levels:
- 1.618: 1.2818
- 2.618: 1.3186
These levels represent potential profit targets or areas where the price might stall or reverse, helping traders optimize their strategies.
Using Fibonacci Extensions to Take Profit
Fibonacci extensions are highly effective in trending markets, allowing traders to plan their trades and manage risk with greater precision.
Step-by-Step Guide
- Identify the Trend: Determine if the market is in an uptrend or downtrend.
- Mark Key Points: Identify the swing low and swing high of the initial move.
- Draw Retracements: Use a Fibonacci retracement tool to find pullback levels.
- Project Extension Levels: Extend Fibonacci ratios (e.g., 1.618, 2.618) beyond the swing high or low.
- Set Profit Targets: Use these levels as potential price targets.
- Monitor Price Action: Watch for signs of reversal or continuation near these levels.
- Combine with Other Tools: Confirm levels with indicators, trendlines, or candlestick patterns.
Advantages of Fibonacci Extensions
- Objective Price Targets:
- Provides clear and objective levels for profit-taking, removing emotional bias.
- Market Psychology:
- Based on natural ratios that reflect collective market behavior, making them highly reactive price points.
- Effective in Trending Markets:
- Best suited for markets with clear directional movement, providing actionable insights.
- Enhanced Risk Management:
- Helps traders define risk-reward ratios and manage positions with discipline.
- Versatility:
- Applicable across all timeframes and asset classes, including forex, stocks, and commodities.
Disadvantages of Fibonacci Extensions
- Subjectivity:
- Placement of swing highs and lows can vary among traders, leading to differing projections.
- No Guarantees:
- Fibonacci levels are probabilities, not certainties, and price may not always react as expected.
- Confirmation Required:
- Relying solely on Fibonacci extensions without additional analysis can lead to missed opportunities or false signals.
- Overuse:
- Applying Fibonacci indiscriminately to all charts can create confusion and inefficiency.
- Self-Fulfilling Prophecy:
- Popularity among traders can sometimes influence price reactions, independent of market fundamentals.
Example in Action
Scenario: EUR/USD moves from 1.0400 to 1.0900 and retraces to 1.0650. Fibonacci extensions project potential price targets:
- 1.618: 1.2818
- 2.618: 1.3186
If the price resumes its uptrend and reaches 1.2818 (1.618), traders may consider taking partial profits. If momentum continues, the next target at 1.3186 (2.618) could provide additional profit-taking opportunities.
Best Practices for Using Fibonacci Extensions
- Combine with Other Tools: Confirm extension levels with indicators like RSI, MACD, or moving averages.
- Watch for Confluence: Look for overlapping Fibonacci levels with support/resistance zones or trendlines.
- Adapt to Market Conditions: Be flexible with your analysis and adjust targets as market conditions evolve.
- Set Realistic Goals: Align profit targets with your risk tolerance and trading plan.
Conclusion
Fibonacci extensions are indispensable tools for traders, offering objective price targets and enhancing decision-making in trending markets. By combining Fibonacci extensions with other technical analysis methods, traders can refine their strategies and achieve greater consistency in their trades.
At ITC Pros, we empower traders with the tools and insights needed to master Fibonacci extensions and optimize their trading performance.
Start Trading Smarter Today!
6- Fibonacci Arcs
Learn Forex: What Are Fibonacci Arcs?
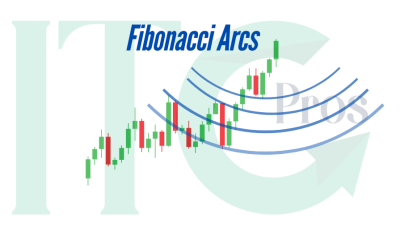
Fibonacci Arcs are useful tools in technical analysis. They help traders find possible support and resistance levels by looking at price movement and time.
These curved lines come out from a line drawn between two main prices. These are often a low point and a high point during a rise in prices, or the opposite during a drop.
Key Ratios Used in Fibonacci Arcs:
- 38.2% (0.382)
- 50% (0.50)
- 61.8% (0.618)
How They Work:
- In an uptrend, Fibonacci Arcs highlight areas of potential support as prices retrace from a peak.
- In a downtrend, they mark resistance levels where a counter-trend rally might stall.
These arcs are especially useful for spotting entry and exit points, making them essential tools for traders managing market oscillations.
Understanding The Fibonacci Sequence
The Fibonacci sequence is a series of numbers where each number is the sum of the two preceding numbers:
0, 1, 1, 2, 3, 5, 8, 13, 21, 34, 55, 89, 144, 233, 377, 610
Key ratios derived from the sequence, such as 61.8% (the Golden Ratio) and 38.2%, play a significant role in identifying retracement and extension levels in trading. These ratios are believed to reflect natural patterns and are widely used in technical analysis to predict market behavior.
How to Calculate Fibonacci Arcs
Identify the Trend: Pinpoint a significant uptrend or downtrend on your price chart.
Select a Baseline: Draw a trendline from a swing low to a swing high (uptrend) or a swing high to a swing low (downtrend).
Determine Key Levels: Divide the trendline length using the key Fibonacci ratios:
38.2%
50%
61.8%
Draw the Arcs: Use the points you calculated to draw half-circles that go up from the baseline. This will create areas that may act as support or resistance zones.
Interpret the Arcs: Observe price reactions around the arcs to identify reversals, continuations, or breakouts.
Interpreting Fibonacci Arcs
Support and Resistance: Arcs act as dynamic support in uptrends and resistance in downtrends.
Prices bouncing off an arc often confirm its role as a key level.
Reversal Zones: Watch for changes in momentum or candlestick patterns near an arc.
Continuation Zones: If price breaks through an arc with strong momentum, it signals a continuation of the trend.
Clustered Arcs: Areas where multiple arcs converge indicate stronger levels of support or resistance.
Volume Confirmation: High trading volume near an arc strengthens its significance.
Understanding A Fibonacci Fan
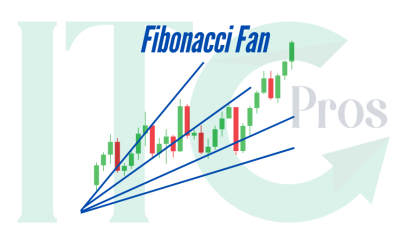
A Fibonacci Fan is a set of lines drawn from an important price point. These lines extend outwards at angles that follow Fibonacci ratios.
These trendlines help traders identify dynamic support and resistance levels in a trending market.
How It’s Constructed:
Select a Pivot Point: Start at a significant swing high or low.
Determine Ratios: Use 38.2%, 50%, and 61.8% serve as the foundation for drawing fan lines.
Draw Trendlines: Extend lines outward from the pivot point, creating a “fan” pattern.
How to Use It:
Support and Resistance: Prices bouncing off fan lines indicate strong support or resistance.
Trend Analysis: Steeper slopes suggest stronger trends; flatter slopes indicate weaker trends.
Dynamic Adjustments: Continuously refine the fan lines as market conditions evolve.
Advantages of Fibonacci Fans and Arcs
Dynamic Analysis: Adjusts to price and time, providing a comprehensive view of market behavior.
Visual Clarity: Clearly marks key levels of support and resistance.
Versatility: Applicable across timeframes and asset classes.
Integration: Combines effectively with other technical tools for stronger signals.
Limitations
Subjectivity: Placement of baselines and pivot points may vary among traders.
Lack of Guarantees: Fibonacci tools are probabilistic, not predictive.
Requires Confirmation: Should be used alongside other indicators for reliable analysis.
Combining Fibonacci Tools for Better Results
Fibonacci Arcs and Fans are most effective when combined with other technical analysis tools such as:
Retracements: To identify pullbacks and extensions.
Trendlines: To confirm breakout or reversal signals.
Candlestick Patterns: To validate potential reversals.
Conclusion
Fibonacci Fans and Arcs offer traders a dynamic and versatile way to analyze market trends, support, and resistance levels. Using these tools in your trading plan can help you find good opportunities, improve your entry and exit points, and manage risk well.
At ITC Pros, we offer tools and resources to help traders learn Fibonacci methods and reach their trading goals.
Start Trading Smarter Today!
7- Combining Fibonacci with Other Technical Analysis
Learn Forex: Fibonacci with Technical Analysis Tools
Brought to you by ITC Pros
Fibonacci tools are versatile instruments in trading, helping traders identify support and resistance levels, refine breakout strategies, and determine optimal take-profit and stop-loss placements. When combined with other technical analysis tools, they provide a comprehensive approach to navigating market dynamics. At ITC Pros, we guide traders in mastering the art of blending Fibonacci with key technical indicators for more precise and confident trading.
Why Combine Fibonacci Tools with Other Technical Indicators?
Fibonacci tools, such as retracements and extensions, offer traders potential reversal and continuation zones. By integrating these tools with additional technical analysis methods, traders gain a more robust framework for:
Validating signals
Improving trade accuracy
Enhancing risk management
Combining Fibonacci with Major Technical Tools
1. Moving Averages
Use Fibonacci retracement levels to confirm signals provided by moving averages (e.g., 50-day or 200-day MAs).
Example: If a Fibonacci retracement level aligns with a 200-day moving average, this confluence strengthens the level’s importance as potential support or resistance.
2. Trendlines
Draw trendlines to highlight trend directions and key levels.
Align Fibonacci retracement levels with trendlines to validate the strength of these zones.
Example: When a 61.8% Fibonacci retracement coincides with an ascending trendline, it provides a strong confirmation of support.
3. Candlestick Patterns
Look for candlestick formations (e.g., hammer, engulfing) near Fibonacci levels to confirm potential entry or exit points.
Example: A bullish engulfing pattern forming at a 38.2% retracement level could signal a strong buying opportunity.
4. Oscillators (RSI, MACD)
Combine Fibonacci levels with oscillators to confirm overbought or oversold conditions.
Look for divergences between oscillator signals and price action at Fibonacci levels.
Example with RSI:
RSI (21): Use Fibonacci numbers (like 21) for enhanced accuracy.
RSI near 30 at a 61.8% retracement level indicates oversold conditions and potential reversal.
Example with MACD:
Bullish signal: MACD crosses above the signal line near a Fibonacci retracement.
Bearish signal: MACD falls below the signal line near a retracement level, confirming resistance.
5. Bollinger Bands
Combine Bollinger Bands with Fibonacci levels to identify breakout or reversal points.
Breakout Confirmation:
Price crossing above the upper Bollinger Band and breaching key Fibonacci levels signals strong bullish momentum.
Reversal Indication:
Price reversal near the upper or lower Bollinger Band aligning with Fibonacci levels indicates potential exhaustion.
6. Price Patterns (e.g., Head & Shoulders)
Integrate Fibonacci levels into price patterns for added confirmation.
Example:
In a Head & Shoulders pattern, the second shoulder often aligns with the 61.8% or 78.6% retracement level, strengthening the validity of the pattern.
7. Volume Analysis
High volume near Fibonacci levels reinforces their significance as support or resistance.
Low volume may indicate weak conviction and reduce reliability.
Advanced Techniques for Combining Fibonacci with Indicators
Fibonacci Retracement with MACD
Look for divergences between MACD and price slopes near Fibonacci levels.
Signals:
Bullish: MACD crosses above the signal line at a retracement level.
Bearish: MACD crosses below the signal line at a resistance level.
Fibonacci Retracement with RSI (21)
Use the RSI (21), a Fibonacci period, to enhance accuracy.
Signals:
RSI near 30 at a retracement level confirms oversold conditions for potential long trades.
RSI near 70 at a retracement level confirms overbought conditions for potential short trades.
Fibonacci Retracement with Bollinger Bands
Confirm breakouts or reversals with Bollinger Bands at Fibonacci levels.
Signals:
Price crossing the upper/lower Bollinger Band while breaching Fibonacci levels indicates a breakout or reversal.
Benefits of Combining Fibonacci with Other Tools
Improved Accuracy: Increases confidence in trading decisions by validating Fibonacci signals with other indicators.
Versatility: Works across different timeframes and asset classes.
Risk Management: Helps set more reliable stop-loss and take-profit levels.
Trend Strength Analysis: Confirms the strength of trends when Fibonacci levels align with indicators like moving averages or MACD.
Key Takeaways
Confluence is Key: The more tools that align with Fibonacci levels, the stronger the signal.
Divergences Matter: Look for divergences between oscillators (RSI, MACD) and price action near Fibonacci levels to confirm potential reversals.
Dynamic Adjustments: Regularly update your analysis as market conditions evolve.
Conclusion
Combining Fibonacci tools with other technical analysis methods creates a powerful synergy for traders. From validating support and resistance levels to confirming breakouts and reversals, this integrated approach enhances precision and confidence in trading decisions.
At ITC Pros, we provide the tools, resources, and expertise to help you master these techniques and elevate your trading strategies.
Start Trading Smarter Today!
8- Candlestick Patterns
Learn Forex: Candlestick Patterns With ITC Pros
Brought to you by ITC Pros
Candlestick patterns are the cornerstone of technical analysis, offering traders valuable insights into price movements and market sentiment. At ITC Pros, we help traders understand candlestick patterns. This helps them make better decisions in Forex trading.
Understanding A Candlestick
A candlestick is a graphical representation of an asset’s price movement over a specific time frame. Candlesticks are used a lot in technical analysis. They show important information: opening price, closing price, highest price, and lowest price. This data is presented in a simple chart format.
Structure of a Candlestick:
Body: Represents the open-to-close price range.
Wicks (Shadows): Illustrate the intra-period high and low points.
Color:
Green (or White): Indicates a price increase.
Red (or Black): Indicates a price decrease.
When combined, candlesticks create patterns that show important support and resistance levels. These patterns help traders predict possible market changes.
Common Candlestick Patterns
Six Bullish Candlestick Patterns
1-Hammer
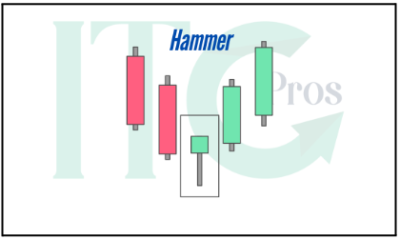
– Short body with a long lower wick, found at the bottom of a downtrend.
– Indicates strong buying pressure overcoming intraday selling.
2-Inverse Hammer
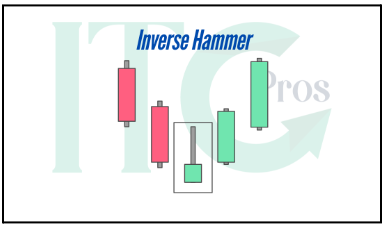
– Similar to the hammer but with a long upper wick.
– Suggests initial buying pressure with insufficient selling to drive the price lower.
3. Bullish Engulfing
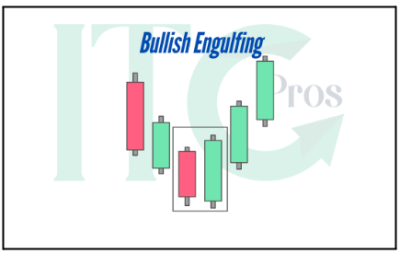
– Two candlesticks: a small red body engulfed by a larger green body.
– Signals a decisive shift to bullish sentiment.
3- Piercing Line
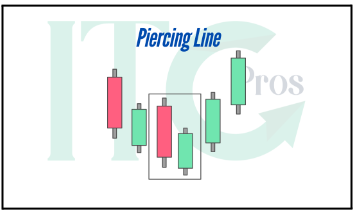
– Two candlesticks are present: first a long red candle, and then a long green candle.
– Strong buying pressure drives the price above the midpoint of the previous red candle.
4- Morning Star
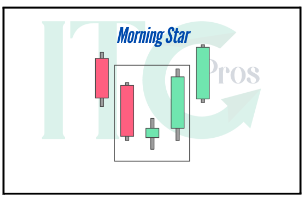
– Three candles: a long red candle, a short-bodied candle, and a long green candle.
– Suggests diminishing selling pressure and the onset of a bullish trend.
5- Three White Soldiers
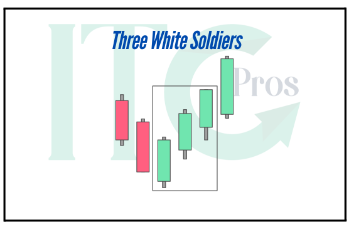
– Three consecutive long green candles with small wicks.
– Indicates sustained buying pressure after a downtrend.
Six Bearish Candlestick Patterns
1- Hanging Man
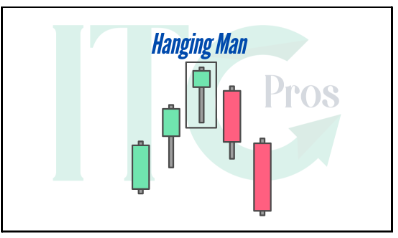
– Resembles a hammer but forms at the end of an uptrend.
– Suggests a sell-off with buyers losing control.
2- Shooting Star
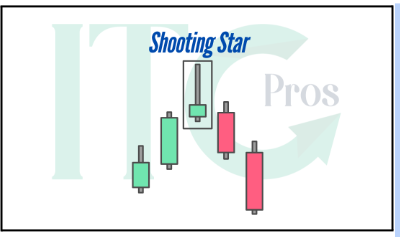
– Similar to an inverted hammer, but forms in an uptrend.
– Indicates potential bearish reversal.
3- Bearish Engulfing
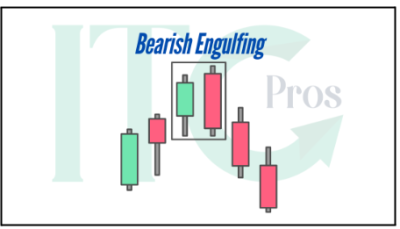
– Two candlesticks: a small green body engulfed by a larger red body.
– Signals a market peak or trend reversal.
4- Evening Star

– Three candles: a long green candle, a short-bodied candle, and a long red candle.
– Indicates the reversal of an uptrend.
5- Three Black Crows
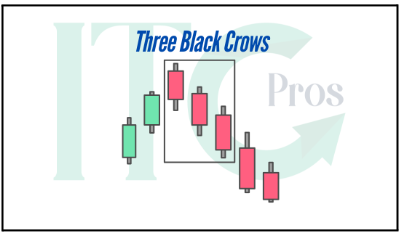
– Three consecutive long red candles with small wicks.
– Suggests strong selling pressure initiating a bearish trend.
6- Dark Cloud Cover
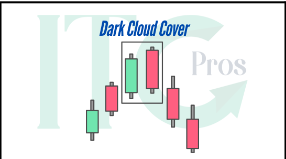
– Two candlesticks: a red candle opening above and closing below the midpoint of a green candle.
– Indicates a bearish reversal.
Four Continuation Candlestick Patterns
1- Doji
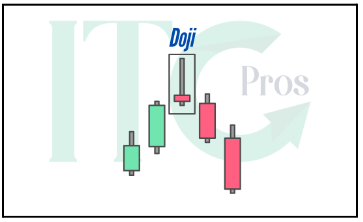
– The open and close prices are nearly identical, forming a cross or plus sign.
– Signals market indecision and often precedes a reversal or continuation.
2- Spinning Top
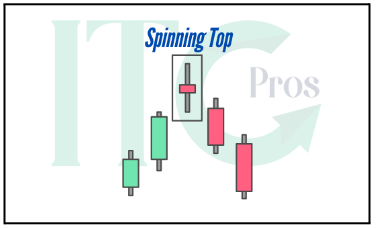
– Small body with equal-length wicks.
– Indicates consolidation or a pause in market momentum.
3- Falling Three Methods
– A long red candle followed by three small green candles, concluding with another red candle.
– Predicts the continuation of a bearish trend.
4- Rising Three Methods
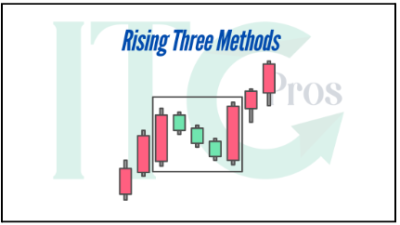
– A long green candle followed by three small red candles, concluding with another green candle.
– Indicates sustained bullish momentum.
How to Read Candlestick Patterns
To effectively interpret candlestick patterns, consider the following steps:
Understand the Components:
Body: Indicates the open and close prices.
Wicks: Indicatest high and low prices.
Color: Indicates market sentiment.
Recognize Patterns:
Identify whether the pattern suggests a reversal, continuation, or indecision.
Analyze Size and Shape:
Large bodies indicate strong price movements.
Long wicks signify price rejection, while short wicks show strong conviction.
Contextualize Patterns:
Place patterns within the broader market trend, support/resistance levels, and trading volume.
Confirm with Indicators:
Use complementary tools like RSI, MACD, or Bollinger Bands to validate signals.
Practice and Backtest:
Study historical data to refine your understanding and strategy.
Tips for Success with Candlestick Patterns
Combine Patterns with Context: Always interpret patterns within the context of market trends and other technical indicators.
Start with Common Patterns: Focus on mastering a few key patterns before expanding your repertoire.
Understand Timeframes: Analyze candlestick patterns across multiple timeframes to capture different market dynamics.
Stay Objective: Avoid overinterpreting patterns—wait for confirmation before acting.
Practice Makes Perfect: Continuously analyze charts and refine your skills through hands-on experience.
Conclusion
Candlestick patterns are invaluable tools for understanding market sentiment and predicting price movements. Whether you’re identifying reversals, continuations, or indecision, mastering candlestick analysis can elevate your trading strategy.
At ITC Pros, we provide traders with the tools, resources, and knowledge to leverage candlestick patterns effectively.
Start Trading Smarter Today!
9- Fundamental Analysis in Forex
Learn Forex: Fundamental Analysis in Forex
Brought to you by ITC Pros

Fundamental analysis is a powerful tool for forex traders, offering insights into the underlying factors that influence currency values. By looking at economic, social, and political factors, traders can understand the true value of financial assets. This helps them predict long-term market trends.
What is Fundamental Analysis?
Fundamental analysis evaluates the intrinsic value of an asset by analyzing the economic, social, and political factors that could influence its price.
Unlike technical analysis, which examines past price movements and chart patterns, fundamental analysis explores the larger factors influencing the market.
Key Features:
- Focuses on economic indicators such as interest rates, employment, and inflation.

Examines long-term trends rather than short-term price movements.
Frequently utilized in trading forex, stocks, commodities, and other financial markets.
Key Factors in Fundamental Analysis
1. Economic Indicators
Economic indicators provide insights into the health of an economy and its potential impact on currency values. Examples include:
GDP Growth: Measures economic expansion.
Inflation Rates: Indicates the purchasing power of a currency.
Unemployment Rates: Reflects the economic stability of a nation.
Interest Rates: Higher rates often attract foreign investors, boosting currency demand.
2. Company Financials
For stocks, analysts examine financial statements such as:
Balance Sheets
Income Statements
Cash Flow Statements
These help assess profitability, growth potential, and management efficiency.
3. Industry Trends
Understanding sector dynamics helps traders identify industries poised for growth or facing challenges, impacting individual stock prices.
4. Macroeconomic Factors
Geopolitical events, government policies, and central bank decisions play a significant role in shaping market movements.
5. Market Sentiment
Analyzing investor psychology through surveys, news sentiment, and social media trends can provide insights into price movements driven by fear or greed.
Example in Action
Consider the relationship between a country’s economic outlook and its currency value:
If a country’s economy is improving, its central bank may raise interest rates to control inflation.
Higher interest rates attract foreign investors, who purchase the country’s currency to invest in its financial markets.
Increased demand for the currency drives its value higher.
Advantages of Fundamental Analysis
Long-Term Perspective: Provides insights into the underlying factors driving asset value.
Intrinsic Value Assessment: Identifies whether an asset is undervalued or overvalued.
Risk Management: Helps assess investment risks and mitigate potential losses.
Investment Discipline: Encourages thorough research and informed decision-making.
Broad Applicability: Useful across financial markets, including forex, stocks, and commodities.
Disadvantages of Fundamental Analysis
Time-Consuming: Requires extensive research and data analysis.
Subjectivity: Different interpretations can lead to conflicting conclusions.
Short-Term Limitations: May not capture short-term market trends or momentum.
Information Overload: The abundance of data can be overwhelming.
Market Inefficiencies: External factors like speculation can distort prices.
Practical Application
Fundamental analysts seek to capitalize on market mispricing. For example:
A stronger economic outlook may prompt interest rate hikes, attracting foreign investment and boosting currency value.
Traders can use this analysis to predict price movements and make informed decisions about buying, selling, or holding positions.
Conclusion
Fundamental analysis in forex trading offers a strategic framework to understand the forces shaping currency values. By examining economic indicators, company financials, industry trends, and market sentiment, traders can assess intrinsic value and identify trading opportunities.
At ITC Pros, we provide the tools, resources, and insights needed to master fundamental analysis and apply it effectively to your trading strategies.
What is crypto?
A Beginner's Guide to Cryptocurrency
Embarking on the world of cryptocurrency can be both exciting and complex. ITC Pros is a trusted leader in trading and financial education. Offering a simple guide and professional way to understand and engage with digital currencies.
1. Understanding Cryptocurrency

Cryptocurrency is decentralized digital money designed for use over the internet. Bitcoin, launched in 2008, was the first cryptocurrency and remains the most prominent. Other notable cryptocurrencies include Ethereum, Tether, and Solana. These digital assets operate on blockchain technology, ensuring secure and transparent transactions without the need for a central authority.
2. What Is Blockchain Technology?

A blockchain is a digital record that securely and transparently tracks transactions, making them tamperproof. Imagine it as a digital book where every page (or block) contains a list of transactions. Once a block fills up, it links to the next one, forming a chain – hence the name blockchain.
Here’s what makes blockchain so revolutionary:
Decentralization: A global network of computers (nodes) maintains the blockchain instead of a single entity.
Immutability: Once information is added to the blockchain, it cannot be altered or deleted, ensuring transparency and security.
Smart Contracts: Platforms like Ethereum enable programmable contracts that automatically execute when specific conditions are met.
Blockchain technology has applications beyond cryptocurrencies.
People use it for supply chain tracking, voting systems, healthcare records, and much more. Think of it as the backbone of the digital economy.
3. Key Characteristics of Sound Money
Sound money possesses attributes such as durability, divisibility, fungibility, portability, recognizability, and scarcity. Bitcoin exemplifies these characteristics, especially in its scarcity, as only 21 million bitcoins will ever exist.
4. Getting Started with Bitcoin

Bitcoin serves as a solid foundation for navigating the crypto space. Understanding its origin, purpose, and functionality is crucial. Bitcoin runs on a shared ledger called the blockchain, managed by a network of computers and protected by cryptography. This ensures that every transaction is verified and immutable.
5. Exploring Altcoins
Beyond Bitcoin, numerous alternative cryptocurrencies, known as altcoins, offer various features and use cases. Ethereum is a decentralized platform that runs various applications, including DeFi platforms and NFTs.
Other interesting altcoins include:
Solana: Known for its high speed transactions.
Cardano: Focused on sustainability and growth.
Polkadot: Designed to connect multiple blockchains for seamless compatibility.
6. Acquiring and Storing Cryptocurrency
To buy cryptocurrency, set up an account with a trusted exchange platform that gives importance to security and user trust.. After purchasing, store your crypto safely in a digital wallet, which holds the private keys to access your assets.
Wallet options include:
Hot Wallets: Connected to the internet, easy to use but less secure.
Cold Wallets: These are offline wallets, such as hardware wallets, providing the highest level of security.
7. Trading Strategies
Engaging in crypto trading requires a solid understanding of market analysis:
Fundamental Analysis : Evaluates an asset’s intrinsic value by examining factors like technology, team, and market demand.
Technical Analysis: Involves studying price patterns and indicators to forecast future movements.
Developing a trading strategy that incorporates risk management and aligns with your financial goals is vital.
8. Security and Risk Management
The crypto market is volatile. The cruciality to use risk management strategies, like setting stop-loss orders and only investing what you can afford. Additionally, be vigilant against common scams and ensure you’re transacting on secure platforms.
Tips to stay safe:
Use two factor verification (2FA).
Doublecheck wallet addresses before sending funds.
Avoid sharing private keys or recovery phrases.
9. Continuous Learning
The cryptocurrency landscape is rapidly evolving. Staying updated with trusted sources and using educational platforms will improve your understanding and help you make better decisions. ITC Pros provides structured lessons, industry insights, and tools to help you confidently navigate the crypto world.
Final Thoughts

Cryptocurrency is reshaping the future of finance and technology. While it may seem overwhelming at first, taking small, informed steps will help you build confidence in this dynamic world.
If you want to learn about blockchain, start trading, or just look into Bitcoin, there are many resources to help you along the way.
Start exploring today with ITC Pros and embrace the digital frontier!
What are Fund Management ?
Unlock Smart Forex Investments with PAMM and MAM Accounts
In today’s fast-paced financial world, forex trading offers exceptional opportunities for investors worldwide. However, not everyone has the time, knowledge, or expertise to navigate the complexities of the forex market. ITC Pros simplifies forex investments with PAMM (Percentage Allocation Money Management) and MAM (Multi-Account Manager) accounts. Making professional money management accessible to all investors.
Whether you’re a beginner in forex trading or an experienced trader looking to diversify your portfolio. PAMM and MAM accounts can help you unlock significant growth.
Understanding Of PAMM Account?
A PAMM account is:
A unique investment solution where multiple investors pool their funds under the management of a professional trader. The term PAMM stands for Percentage Allocation Money Management. Highlighting its ability to proportionally distribute profits or losses based on each investor’s contribution.
How Does a PAMM Account Work?
Here’s a step-by-step breakdown:
Fund Pooling: Investors contribute funds to a PAMM account managed by a skilled trader.
Professional Trading: The manager uses their expertise to trade on behalf of the group.
Proportional Distribution: Profits and losses are shared among investors. According to their contributions.
Performance-Based Fees: Managers earn fees based on their trading performance, ensuring their interests align with investors.
Example: If an investor contributes 10% of the total funds in a PAMM account. They will receive 10% of the total profit or bear the same percentage of the loss.
Benefits of PAMM Accounts for Beginners
PAMM accounts are particularly ideal for beginner traders because they offer:
Hands-Off Investing: Professionals handle trading, so beginners can focus on learning and other priorities.
Expert Management: Skilled money managers implement strategies to maximize returns.
Transparency: Investors can track trading activity and monitor performance in real time.
Diversification: Beginner traders can diversify portfolios without needing in-depth market knowledge.
Understanding Of MAM Account?

A MAM account (Multi-Account Manager) allows professional traders to manage multiple investor accounts through a single master account. Unlike PAMM system accounts, MAM accounts provide more flexibility by enabling customized trade allocation settings for individual sub-accounts.
How Does a MAM Account Work?
Here’s how MAM accounts operate:
The money manager trades through a master account.
These trades are replicated across multiple investor accounts in real time.
Allocation settings are tailored based on each investor’s risk tolerance and goals.
PAMM vs. MAM Accounts: Key Differences
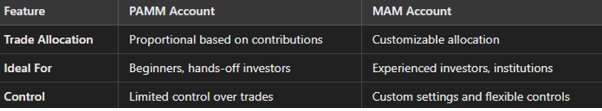
Why Should You Consider ITC Pros for PAMM and MAM Accounts?
At ITC Pros, we combine innovation, transparency, and professional management to deliver exceptional results:
Expert Money Management: Our vetted managers use proven strategies to grow investments.
Complete Transparency: Real-time reporting and fund tracking ensure peace of mind.
User-Friendly Platforms: Trade seamlessly with cutting-edge tools.
Flexible Investment Options: Deposit or withdraw funds anytime.
Key Features of ITC Pros’ PAMM and MAM Platforms

Real-Time Tracking: Monitor trades, profits, and fund activity.
Seamless Execution: Enjoy hassle-free trade replication.
Performance Insights: Access detailed reports and manager performance metrics.
Frequently Asked Questions (FAQs)
- How do PAMM and MAM accounts differ?
PAMM accounts distribute profits proportionally, while MAM accounts offer more customized trade allocation.
- What is the security level of PAMM and MAM investments?
At ITC Pros, funds are managed by vetted professionals, ensuring transparency and security.
- Can you withdraw money whenever you want?
Yes, ITC Pros allows investors to deposit or withdraw funds at their convenience.
- How are profits distributed in PAMM accounts?
Profits are shared proportionally based on each investor’s contribution.
Start Your Forex Investment Journey with ITC Pros
Are you prepared to make your forex investments simpler? With ITC Pros, you can access professional money management solutions tailored to your goals. Whether you select a PAMM or MAM account, our platforms offer transparency, flexibility, and expert guidance to help you succeed.